
It doesn’t matter how long I’ve been in the tech industry, two things never seem to change for me. The first is that when starting a new job my impostor syndrome promptly kicks in, convincing myself that surely this time they will figure out that I’m a fraud. The second is that going on-call for a whole system scares the shit out of me.
This feeling has been exacerbated by the fact that when I joined Unruly I wasn’t just starting a new job, but also shifting away from my specialism. After well over a decade of work on Front End and Web Applications, my role at Unruly is the first since my junior years, in which I am not only predominantly focused on a Back End system, but on a truly distributed one.
While I’ll be the first to advocate for Front End development as a form of distributed system itself, working on a high throughput Ad Exchange represents a departure from my comfort zone and so the idea of being on-call in such an environment triggers all my fears and self deprecating demons.
The following article began as a write up intended for internal consumption by my team at Unruly. The guiding idea being that if I, as a Team Lead, share a candid description of the event, demystifying the process, the confusion and uncertainties I felt, then perhaps it will make it easier for our newcomers to feel less fearful of going on-call. As the piece came together I realised this could be useful for individuals outside of Unruly too, and so, have decided to share it more widely.
The Long Night
In my team at Unruly we go on-call for periods of two weeks. These two weeks are split between a week spent as Primary, meaning you get paged immediately by any critical alert, followed by a week as Secondary during which you only get paged if the Primary escalates the situation or fails to respond to the alert in reasonable time.
Our story begins with me, tired after a long rock climbing session on a Sunday night in October, arriving home with the intent of showering and crashing into bed just as the first alert comes in.
The First Alert: SiteDetails Freshness
Nagios, my old foe, the one unchanged constant for the bulk of my 17 year career, popped up on my phone.
Sites Details aren't fresh on one of our United States Ad Exchanges, the alert notifies me. To understand what this means you need a basic understanding of what we do and how our system is architected.
At Unruly we work in the online video advertising space and my team is in charge of our Supply Side Platform. What that means is that we maintain the system that auctions off space on publishers’ websites to the highest bidder, enabling Advertisers the opportunity to use that space. The Ad Exchange, one of the services in this platform, runs the actual auction, meaning that it reaches out to bidders around the world, declares a winner based on various auction mechanics and hands off the winning bid to the advertising space.
The Sites Details is a list of all the Publisher sites we could potentially serve ads on, and it is provided to each of our Ad Exchanges via an automated process which ensures this list is kept up to date.
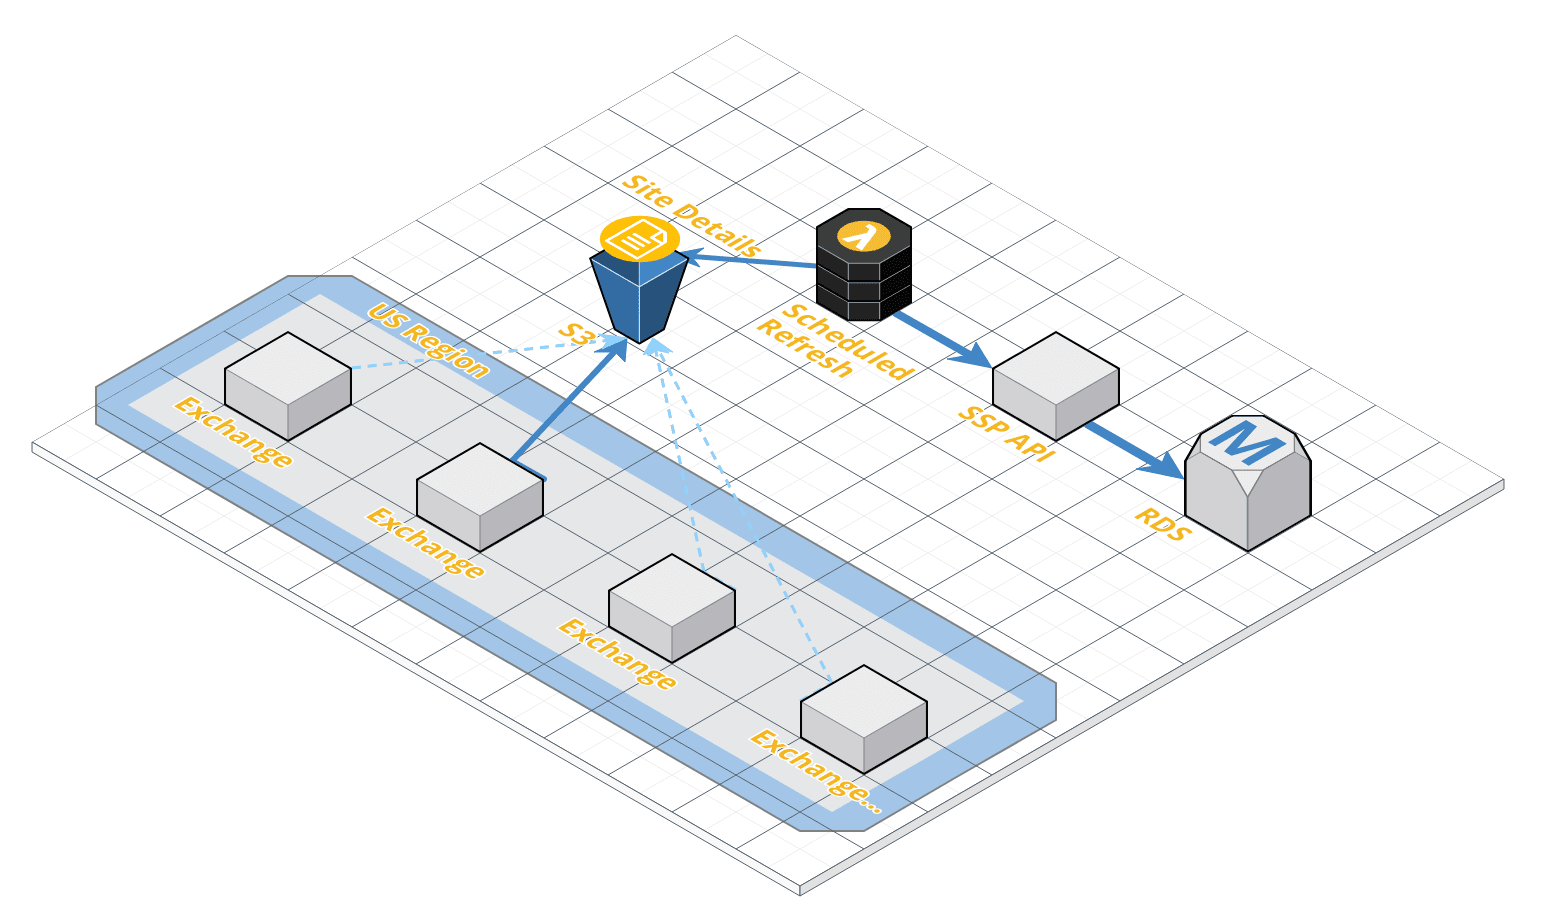
The process begins with an AWS Lambda, a small self contained Node.js service, which runs on a scheduled interval. Whenever the Lambda executes, it reaches out to our Supply Side Platform API, which in turn reaches out to our database and requests the most up-to-date list of Publisher websites. That same AWS Lambda then places a fresh copy of that list on AWS S3, a cloud storage service. A separate service, scheduled at a different interval, runs on each Ad Exchange, reaching out to S3 in order to fetch this fresh list and stores it in memory for easy & fast access.
The freshness of this data is paramount to the function of an Ad Exchange as it ensures not only that we serve ads on the correct publisher websites, but also that the auction mechanics applied to each of these websites are configured correctly.
Immediate Response to the Alert
I began by jumping into Slack and notifying my team that I’m looking into the issue.
Top Tip: Notifying the team is an important first action as it means other developers on the team, who might have noticed the alert going off, may now rest assured that the Primary on-call is aware and is handling the issue.
Inspecting the details of the alert I discovered though that it wasn’t true that the Sites Details are stale, but rather, that the Health Check was returning an HTTP 500 error. A 500 error means that the service running inside the Ad Exchange was unable to verify the freshness of the data and panicked as a result.
As I began contemplating the meaning of this, a second wave of Nagios messages came in notifying me that response times were climbing across the board on multiple Ad Exchanges in the United States.
It was at this point that one of my colleague, Alex Wilson, popped up on Slack and declared: “Something appears to have gone very wrong”.
The First Wave: Response Time Warnings
As alerts across multiple Ad Exchanges began going off I realised there must be some external factor effecting all of them, rather than a specific issue on a specific exchange, but being less experienced at diagnosing distributed systems I had not yet developed strong instincts as to where to look for the issue.
Searching for a piece of information which might point me in the right direction I opened a terminal and connected to one of the offending Ad Exchanges. Once inside the Ad Exchange I began reading through the logs in search of a hint as to the source of the problem.
In parallel I opened up our monitoring dashboard, Grafana, where we can see detailed statistics about the health of our system. The graphs brought to my attention several key pieces of the puzzle. First of all, auctions had dropped dramatically. This is a key business metric as these auctions are our main source of revenue, so a drop in auctions quite simply means a drop in revenue for the company. Second, the drop-off was limited to the United States. The rest of the world seemed to be operating fine.
Jumping back to the terminal I eyeballed our logs hoping to find some explanation for the issues, but I quickly found myself overwhelmed by information. Our logs were noisy, full of data, and even though some of it could potentially have been illuminating, it became increasingly difficult to distinguish relevant from irrelevant. We have since invested time in cleaning out as much of that noise as possible, keeping only useful information.
Top Tip: Invest time ensuring that you have the proper observability into your production system to be able to identify the source of an issue as it is happening. This is true both for your choice of monitored metrics and your choice of actively logged information. When an outage happens, you will be grateful to your past self for taking the time to ensure these things are in place.
At this point James, my team’s Secondary on-call that week, received an alert themselves and joined me remotely in search of the problem.
The metrics
Having a Secondary on-call is not only a backstop in the case that a Primary fails to respond, but is also a useful source of support when a problem becomes overwhelming for a single person to handle alone. In this case, falling back on the support of my Secondary was a relief as James is an experienced engineer who has spent time diagnosing JVM based services and distributed systems.
By this point Alex, James and I had all spent half an hour or so trying to diagnose the issue which had by now impacted half a dozen or so Ad Exchanges. In that time we had dug through our monitoring services and logs, noting down any piece of information as we came across it, but none of us could spot a clear culprit for the misbehaving Ad Exchanges.
That said, we did notice a pattern in our monitoring which revealed several things:
- The Ad Exchanges were having trouble talking to the outside world. Attempts to access services such as S3 and other Unruly services were consistently failing.
- The CPU on the offending exchanges was working harder than usual and the number of connections hitting our Nginx servers was climbing.
- The exchange was running out of memory. The log revealed that the exchange was suffering from repeated exceptions stating java.lang.OutOfMemoryError: Java heap space, meaning our code was allocating space for something but was unable to then release this space, eventually running out of memory.
These issues were further evidence of a problem, but none of them revealed the source of the problem. I made several attempts to identify a networking issue, such as an inability to reach the outside world from within the servers hosting the Ad Exchanges themselves, but everything seemed to work as expected. Though the Ad Exchange service was running out of resources, the servers themselves (on which the services run) seemed to be behaving correctly, despite doing so under pressure of hosting a distressed service.
I decided it’s time to for a hard restart.

The First Restart
As developers we have a love / hate relationship with hard restarts. It’s annoying to do, because it is an admission that we don’t know why our code is misbehaving, but it works more often than not.
Choosing to experiment on the first Ad Exchange to exhibit the problem, the one that first alerted me that night, I ran the command to restart the service. This doesn’t reboot the machine, but it essential clears the resources taken up by the current service and lets it start from scratch. This is far from ideal, as it means any auctions running on the Ad Exchange will be jettisoned, but as the service was already suffocating and was unable to process those running auctions, this felt like a reasonable compromise.
Sure enough, the Ad Exchange went back to normal, processing auctions as they came in and we could see the money begin to flow through it again.
James and I divvied up the remaining misbehaving Ad Exchanges and restarted them all. The metrics across the board seemed to be stabilising and the system was going back to normal. As I was primary, I told James I’d keep an eye one things as the system catches up on things, and to get some rest.
The Second Wave: A Slow Decline
It was past 2am and I could begin to feel the fatigue taking over, so I quickly jumped in the shower. My hope was that by the time I’m ready to go sleep the system would have been stable long enough for me to confidently consider the incident handled, assuming I could postpone the investigation to tomorrow. But as 2:30am crept my way, and I began to hope all was over, Nagios my old friend called out, and I swore as the first Ad Exchange I had restarted began to spike again. Response times were slowly climbing, auctions were down and I cried inside as I came to terms with the fact that tonight would likely be a long one.
Luckily James reappeared online, he too had been keeping an eye on the metrics. We spent another fifteen minutes searching for answers in the logs, AWS dashboards and monitoring but failed to identify a clear source of the problem.
Realising that 3am was looming and we were not making any headway we began to contemplate the possibility that neither of us could solve the issue with the information we had. Accepting that, we thought it might be time to search for a stopgap that will carry us through the night and allow us to utilise the entire teams’ support in the morning.
We ran through several potential solutions, such as diverting all US traffic to our Ad Exchanges distributed around the world or doubling the number of servers we have in the region in the hope that the additional resources will carry us through the night. What we realised though was that many of the potential underlying problems, such as a malicious DDOS attack, could actually be made worse by diverting the traffic; infact, in some cases, this might actually broaden the problem.
There was only one solution we could identify that we knew would work, even if only for a short period of time, and that was a hard restart.
To buy some time I threw together a little script that would connect to each of our US Ad Exchanges and restart it. In the meantime James configured a cronjob, a sort of scheduled task runner, to restart all of our US Ad Exchanges every half hour.
As expected, there’s an XKCD for that. (There’s an XKCD for everything)
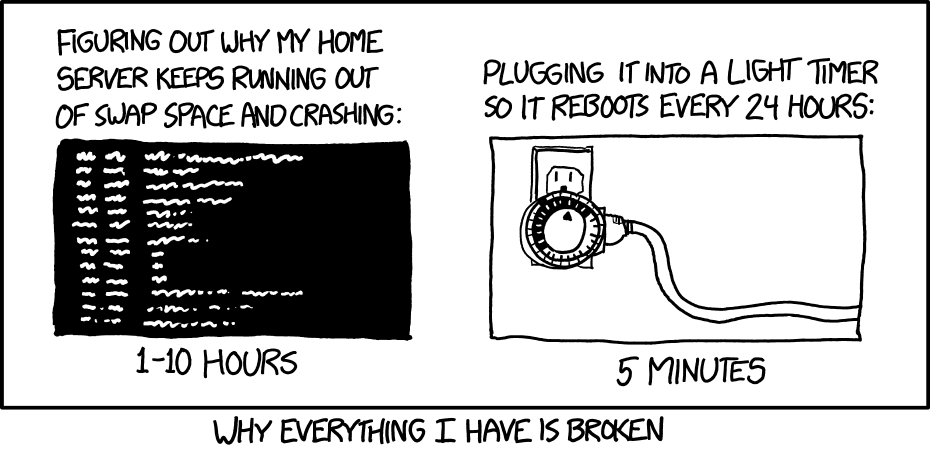
4:30Am came and went by the time we had our stopgap in place and we’d verified that it was having the required effect, but auctions were running, money was flowing, and we gladly crashed, grabbing a few hours of precious sleep.
Red Cards Across The Board
The job of Primary on Call ends at the start of the workday, as the team assemble for morning standup and production issues can be picked up by the team as a whole; but that doesn’t mean our story ends here.
As this post is about how we handle production incidents, I feel it is worth covering how my team approached investigating the incident and presumably, if you have read this far, you’re also curious what the issue dragging down our Ad Exchanges actually was.
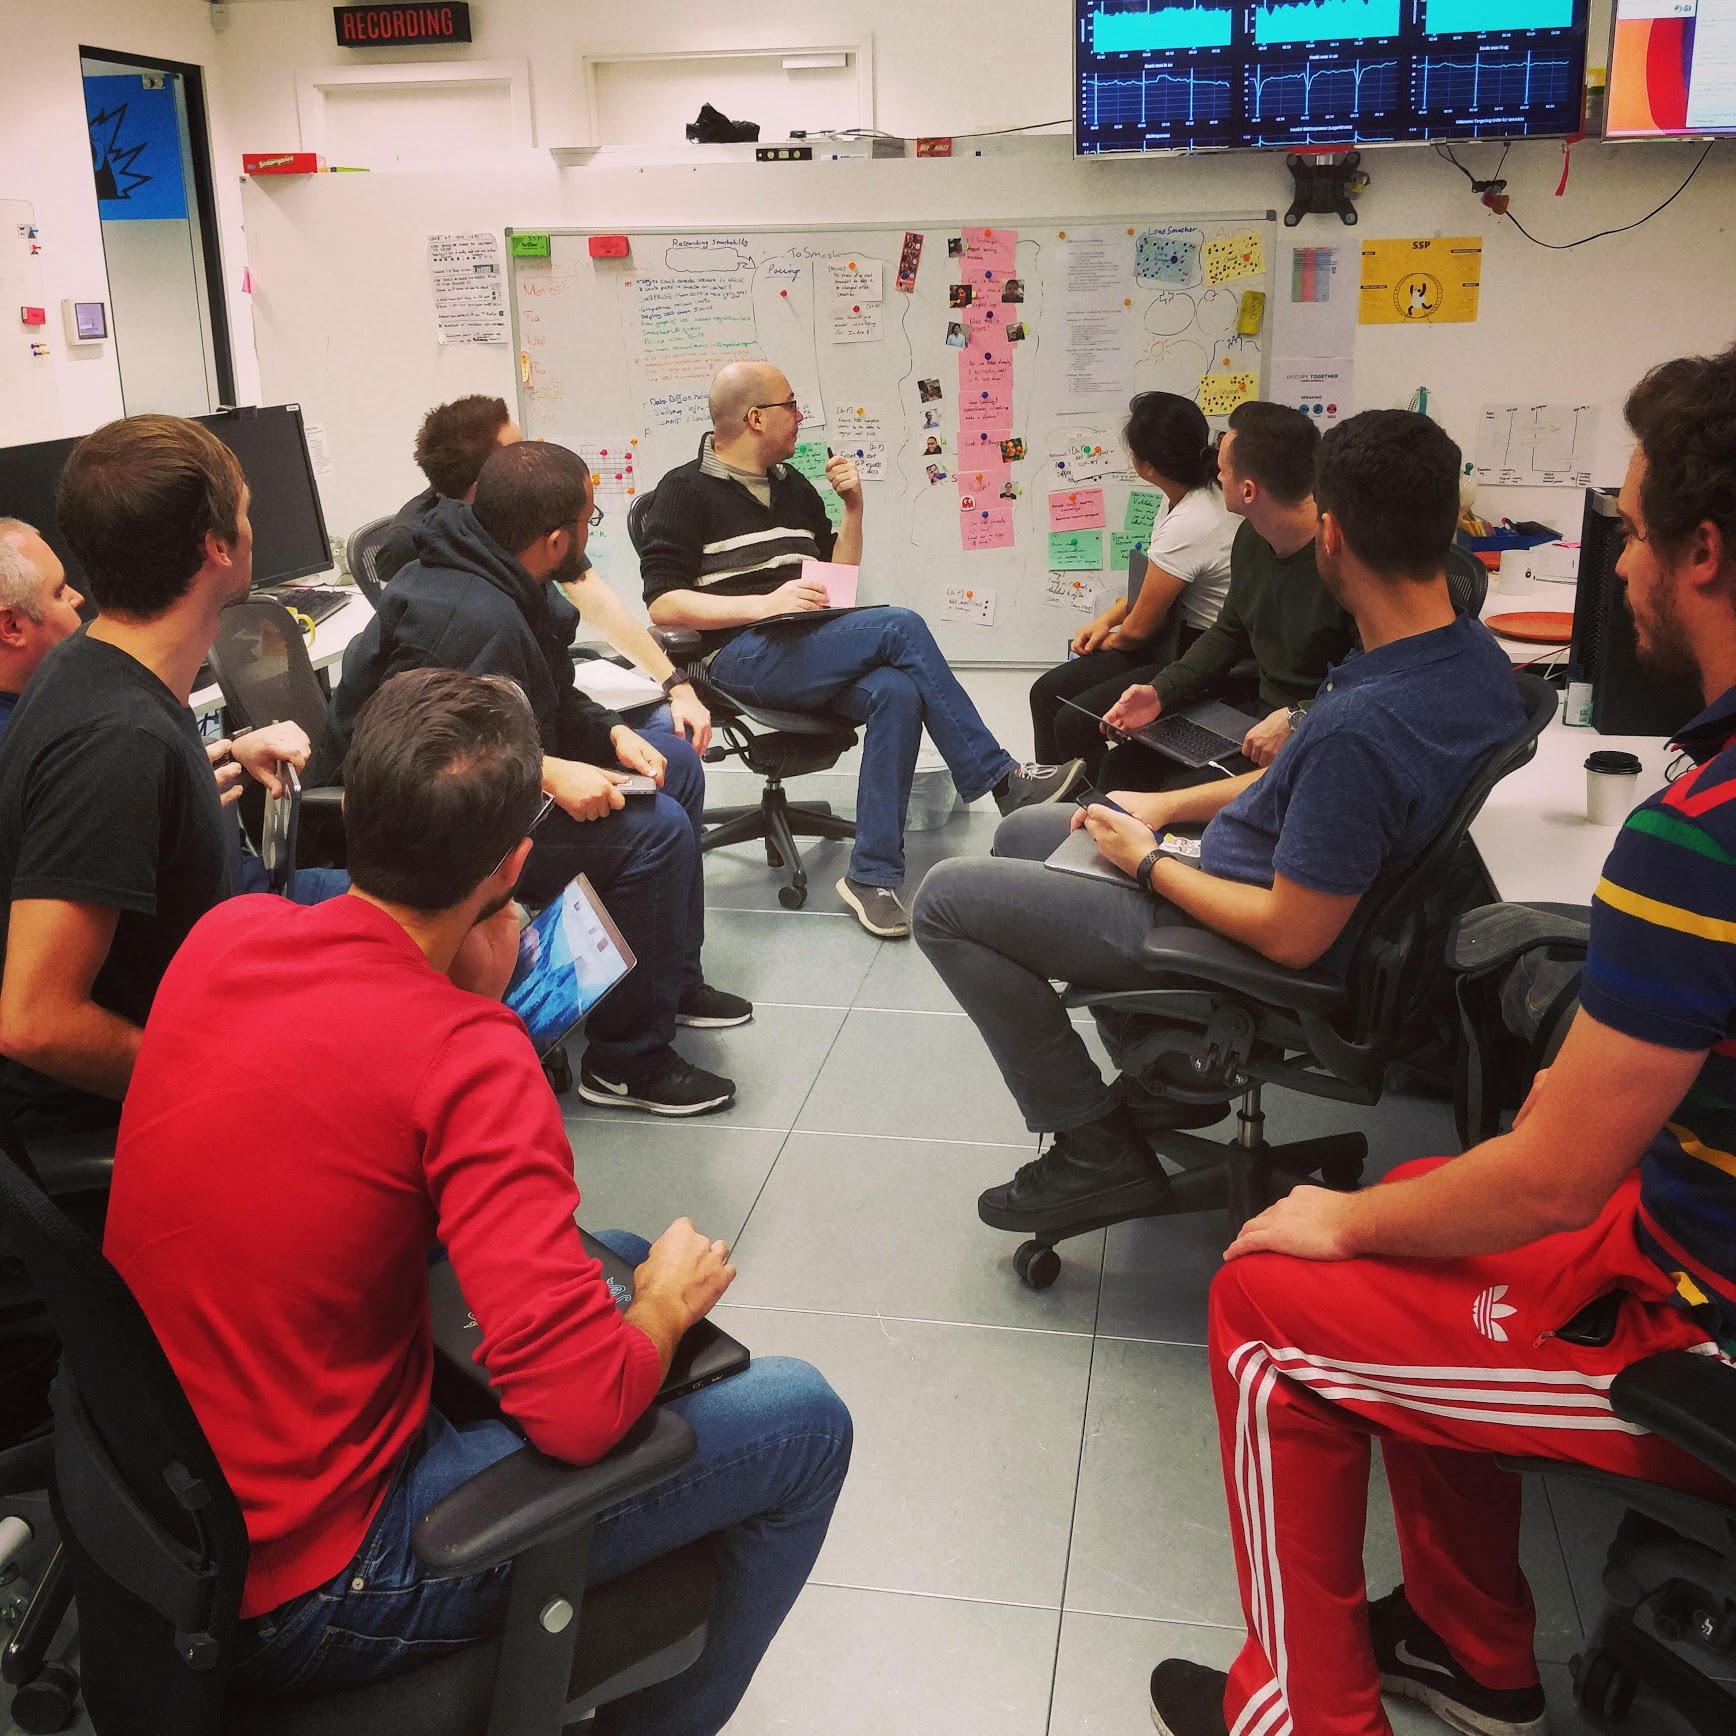
As I walked into the office in the morning the team had already assembled at our Agile Board, where the team maintains the lifecycle of our User Story cards (White), Technical Development cards (green), Research cards (Blue) and when needed Incident cards (Red). Ad Exchanges that can’t stay up for longer than half an hour definitely qualifies as an incident, and so the team had already began to write up the suitable Incident card.
Usually an incident would require a single incident card, but the unique nature of this incident, the lack of any obvious root cause, left us with many questions and very few leads.
We chose not to leave anything off the table.
As you can see on the board, eight different red incident cards were written up. Each card represents a specific avenue of research which the team hoped would lead us to the source of the issue.
These cards ranged from verifying that this wasn’t a DDOS attack, to investigating the possibility of an AWS infrastructure incident and through to improving the the cronjob which was restarting the Ad Exchanges in order to stagger the restarts (rather than restart all Ad Exchanges in parallel) to reduce the commercial impact.
The first thing my team does when a incident kicks off is designate a Disruption Champion. The champion is a team member who volunteers to coordinate the response effort, acts as a single point of truth for all communication with the rest of the business and acts to ensure the team is responding well to the incident. An example of the kind of thing the Champion might take responsibility for is ensuring the team remains committed to our working agreements, as there is always a danger that the added stress of a production incident might cause us to relax our self discipline.
Once a champion was anointed, the team was free to prioritise the different incident cards and divvy up the work. If you look closely you will spot a bunch of magnets with people’s faces, and you’ll also note they are laid out in pairs. As Unruly practices Pair programming, we mostly assign pairs to the cards we work on, incident cards are no exception.
Heaps of Heap Dumps
Of all the incident cards on the board, the card I was most curious about was the one titled Out of Memory, and I paired up with Tom to investigate.
As the topic of this post is the incident response, rather than the detailed investigation, I’ll give you the short version.
Tom and I were curious what caused the memory of the affected Ad Exchanges to spike, as we believed the lack of memory was the main cause of the service’s inability to process incoming traffic.
One of methods used to investigating memory buildups is taking a Heap Dump, which provide a snapshot of the memory allocation in the service at a specific point in time. Investigating multiple Heap Dumps by comparing them both to healthy Ad Exchanges, and to themselves at different stages of the failure state, unearthed an interesting pattern. It seemed we were predominantly accumulating certain types of Objects in memory at an unsustainable manner, predominantly the URI, Connection and HttpHost types.
This suggested something in our Ad Exchange was attempting to make HTTP connections to other services in our distributed system, but was unable to dispose of the memory it was allocating for this IO operation.
A Busy Highway Of Data
If this problem were exhibited across our system, we would have suspected a logical error resulting in a memory leak of some kind, but as this problem was only appearing in the US, we were skeptical the problem would be found at code level, as we would expect such a problem to appear across the board rather than in just one region.
To understand the complexity of this problem, it would help to understand the broad landscape in which our architecture is laid out.
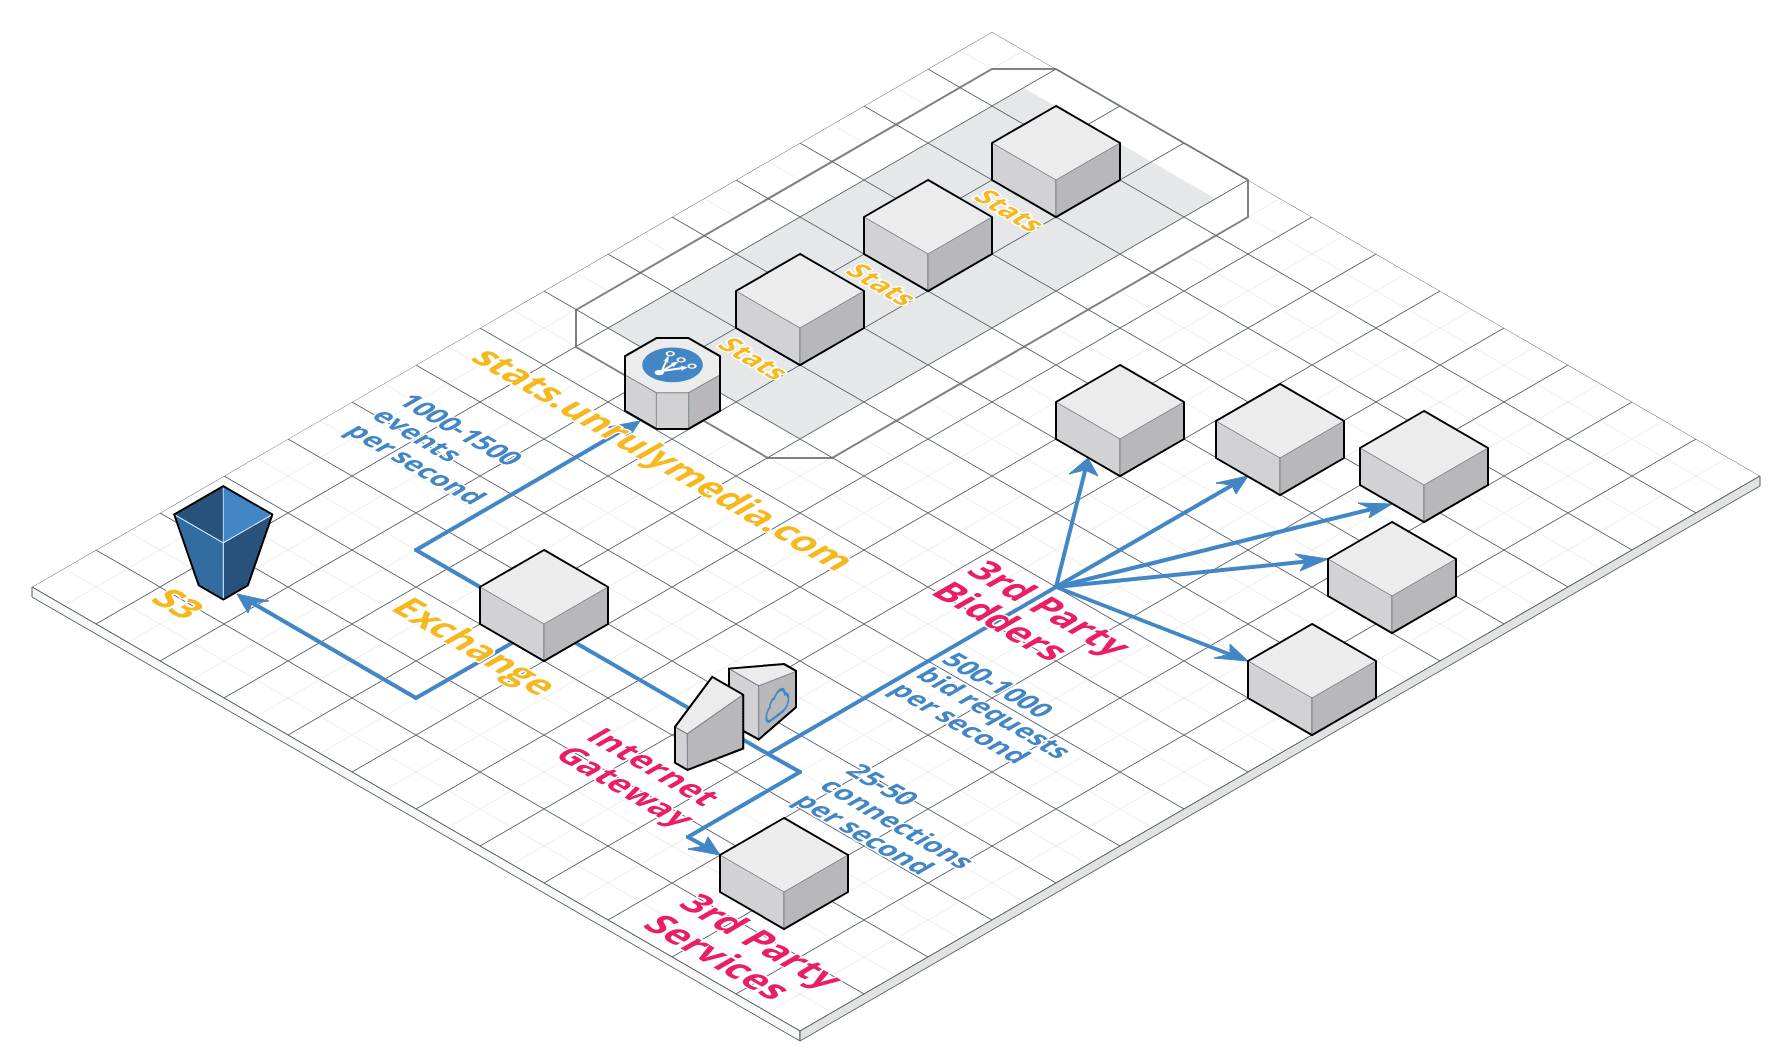
We balance the traffic in each region between multiple Ad Exchanges and each Ad Exchange communicates independently with a variety of services, both co-located with our Ad Exchanges and third-party services operated by business partners of ours.
In the diagram above you can see an approximation of the average amount of connections an exchange has to maintain at any given time. As you can see, each Ad Exchange operates at a relatively high constant rate of communication with the outside world. Consequently, any build up of Connection objects is likely to deplete the server’s memory quite quickly if not released.
In an attempt to understand the scope of the problem we realised that even though our HTTP connections were accumulating, they were in fact completing their intended data transfer. This means the precious auction data itself was reaching the other services which our Ad Exchanges communicate with (a critical commercial question at the time of the incident), but then the Ad Exchange would fail to sever the connection and dispose of the memory allocated for the operation.
How We Solved The Problem & What we learned
Over several days we investigated the memory buildup and came to several conclusions which I believe are worth sharing.
The incident uncovered a design flaw in our Ad Exchanges but luckily the flaw was caught fast enough to mitigate the potential financial impact and in addition it also taught us a very important lesson which has helped us safeguard our operations since.
To understand the design flaw it is important to ensure that, when asking what was the root cause of the incident?, we don’t take the easy path of stopping at the first answer. Specifically, we have to go deeper than the simple answer of we have a memory leak of HTTP connections. The truth is that in most cases, a technical fault like that is not the root cause, but rather it’s a symptom of a deeper issue.
Lets play the 5 whys (even though 4 seems enough in this case):
What's wrong? our Exchanges are running out of memory
Why? we have too many HTTP connections
Why? Because we aren’t closing our connection objects
Why? Because we assumed that a connection would either be successful or throw an error
Why? Because we migrated a synchronous process to an asynchronous one without planning for the additional failure modes
Ah… Right. Let me explain.
One of the systems you will see in the diagram above is a service labeled stats. Stats is a catch-all service to which our entire system reports event statistics in order to enable observability and reporting over all of our business metrics and aggregation of key business data.
Historically, a large percentage of the statistics reported by our Ad Exchanges was logged into static files on each Ad Exchange which would then be aggregated into a centralised data pipeline. Recently though we made a major change to this mechanism. In order to reduce the amount of state on our Ad Exchanges, we migrated from this static log file method to an HTTP based method by which we send the data directly to our stats service.
A key difference between these two methods is that when logging to a local file we’re dealing with a synchronous operation in which we know immediately whether it has succeeded or failed. On the other hand, communicating with an external service over HTTP, a very common pattern in distributed systems, is an asynchronous operation which introduces a new set of potential failure modes which we now needed to take into account.
In the case of this incident, it seemed a yet unidentified problem was causing our HTTP connections to stay open despite completing the data transfer. It took days to validate that the data transfer to stats was completed, that no data loss has occurred and that the connection buildup in the Ad Exchanges was of stats connections, but once we had this confirmed our attention turned to addressing the failure mode.
I hate to bore you with the details, but broadly we’re talking about ensuring that an ideal connection pool is available within each Ad Exchange, that lingering connection objects are timed-out after a suitable duration and that better observability is in place for this kind failure mode.
Once in place, these changes left our Ad Exchanges resilient enough to handle the build up of unclosed HTTP connections, allowing us to remove the scheduled restarts and return to normal operation.
From my perspective, the root cause of this production incident, was a lack of due consideration when migrating from a synchronous operation to an asynchronous one. I am glad though that the failure was so impactful, as it gave my team the chance to challenge our working practices under stress, pull together around a major incident and learn a valuable lesson which we have been able to put into practice since.
Wait Wait Wait… but what was the problem???
OK, you caught me, I never actually told you what the problem was.
What was causing our connections to stay open after completing the data transfer? And why was this only happening in the US?
Well, within days of the production incident taking place we had already stabilised our system, and within two weeks we were confident that it wasn’t an issue in our setup.
We ran through a whole variety of theories, such as issues in the configuration of our load balancers or reverse-proxies, in the versions of the Operating Systems our services run on or the versions of Java that we use.
No clear culprit could be found and as we had already achieved the resilience needed to essentially ignore the issue, we decided we could make do with monitoring the volume of failed connections. The way we figured it, if our monitoring showed a rise in failed connections in the future, we would catch it earlier and we could then invest more time into the problem.
Except, surprise! Several weeks later, just as the clock hit midnight in our US region, the monitored number of failed connections dropped to zero. The problem disappeared in and of itself.
We still have no idea what the underlying issue was, nor what made it disappear. That said, considering the change took place out of work hours, we think it’s safe to assume that AWS themselves fixed something on their end.
But I suspect we’ll never really know.